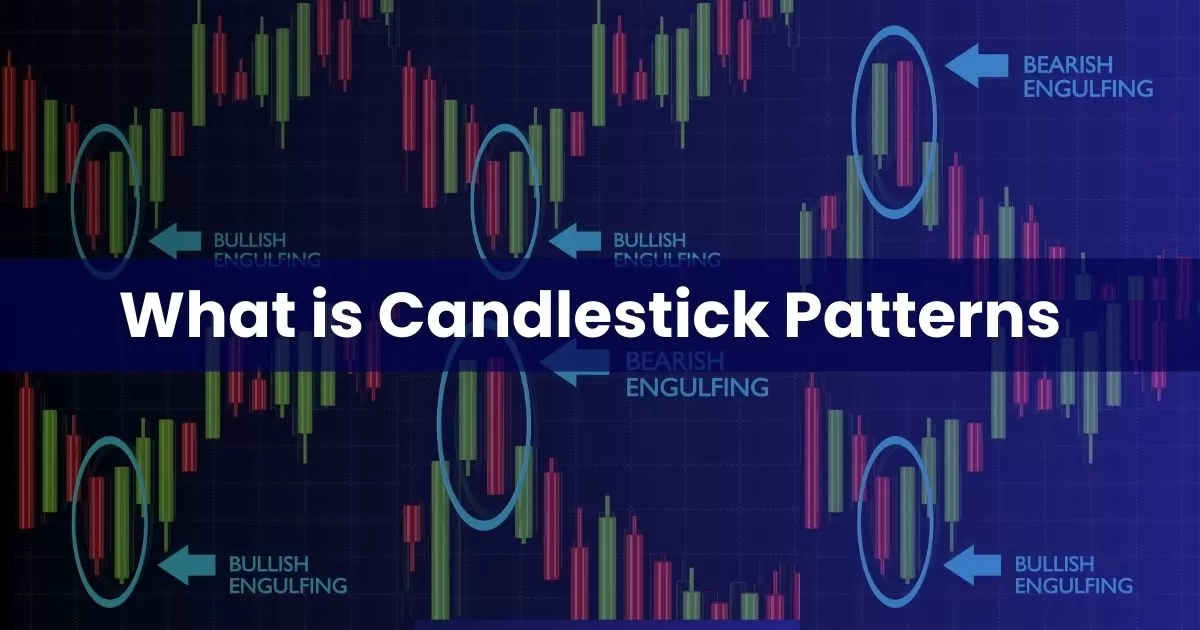
A candlestick pattern is a visual in the financial markets. It shows price movement over time. Traders use these patterns to predict future price action. Knowing what is a candlestick pattern can help with trading strategies. Each candlestick gives you opening, closing, high and low prices. Patterns form when multiple candlesticks appear together. This can be a sign of a reversal or continuation. Learning to recognize these patterns is key to making informed trading decisions. Master the candlestick patterns and you’ll get an edge in the market.
Quick Summary
Candlestick patterns are visual in trading to show price movement over time, so you can understand the market. Each candlestick has three parts: the body, upper wick, and lower wick which represent different price points and reflect market sentiment. To read candlestick patterns look for shapes and colors to predict future price action as explained in the “How to Read Candlestick Patterns” section. Different markets can have different candlestick behaviour so make sure you know where you are trading. Get to know common candlestick patterns like Dojis and hammers as they can be a sign of a reversal. Use candlestick patterns as part of your overall trading strategy for better decisions and more success.
What is a Candlestick Pattern
Definition and Basics
A candlestick pattern is a visual in trading. It shows price movement over time. Each candlestick is market sentiment for a specific period. For example one minute, one hour, or one day. Traders look at the shape and color of the candlestick to see who’s in control, buyers or sellers.
Knowing these patterns is key to trading. They help you predict future price action. By looking at how price has moved in the past you can make better decisions. Recognizing different candlestick patterns can mean successful trades and effective trading strategies.
Trading
Candlestick patterns are important in trading. They help you spot reversals and continuations. A reversal means the price trend is about to change direction. A continuation means the current trend will continue.
Traders use these patterns to make decisions. They look at patterns before entering or exiting trades. This helps to manage risk. For example, if you see a bullish engulfing pattern or a bullish candlestick pattern like the Three White Soldiers, you may buy. If you see a bearish pattern you may sell. Reversal patterns are significant as they indicate the end of the current trend and the potential beginning of a new trend in the opposite direction.
Candlestick analysis has a big impact on trading strategies. Traders can develop plans based on market behavior. Successful traders use these patterns to guide their actions.
History
The history of candlestick patterns goes back to Japanese rice traders in the 18th century. They used simple charts to track rice prices. Over time they developed techniques that evolved into modern candlestick charting.
In the late 20th century Western traders started to adopt these methods. They saw the value in visual price data for trading decisions. Now candlestick charts are used globally.
The history adds to the understanding of candlestick patterns today. Traders are using centuries-old techniques with modern technology. This has made the hammer candlestick pattern charting more powerful and more accessible than ever.
Composition of a Candlestick Charts
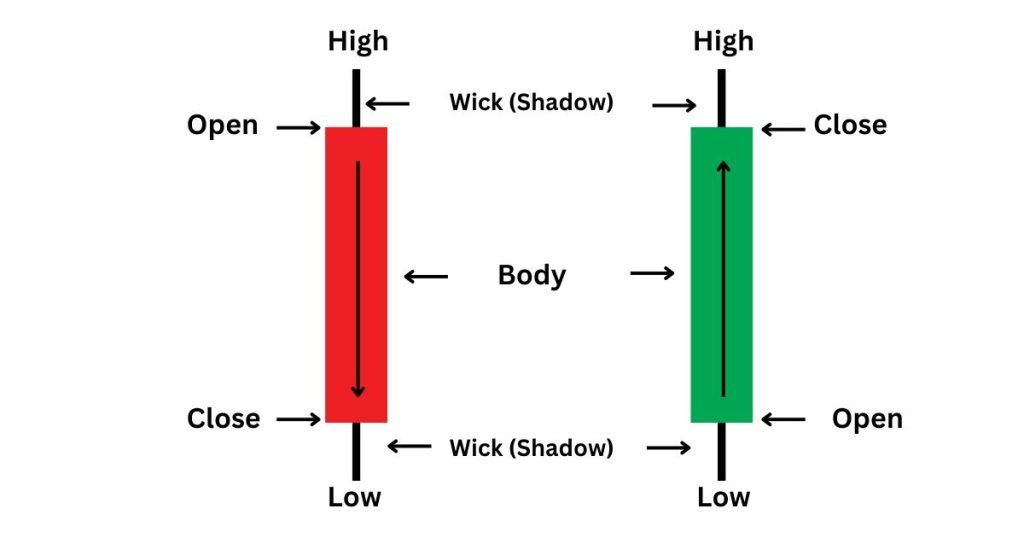
A candlestick chart consists of several horizontal bars or candles, each representing a time period and the data corresponds to the trades executed during that period. Each candle has four points of data: high, low, opening price, and closing price. The body of the candle is colored either Red or Green, indicating the direction of the stock price. The vertical lines above and below the body are called wicks or shadows, showing the lows and highs of the traded price of the stock during the trading session.
How to Analyze a Candlestick Charts
The body of the candle represents the opening and closing price of the trading done during the period. The color of the body can tell traders if the stock price is rising or falling. The wicks or shadows above and below the previous candle’s body show the highs and lows of the traded price of the stock. A combination of these displays the market sentiment towards the said stock.
Parts of a Candlestick
Body, Wick, and Shadow
A candlestick has three main parts: the body, wick, and shadow. The body is the price movement for a specific period. It can be filled or hollow. A filled body means the close is lower than the open. A hollow body means the opposite.
The size of the body matters. A big body means strong market sentiment. This means buyers or sellers are in control. The color of the body also plays a part. A green or white body means strong buying pressure. A red or black body means selling pressure.
The wick extends from the body. It’s the price movement during the trading session. Long wicks mean prices moved a long way outside the open and close prices. This can be rejection levels where traders change their minds to buy or sell.
Open, High, Low, Close (OHLC)
The OHLC is the foundation of candlesticks. The open is where the trading starts for a period. The close is where it ends. These two prices are the market sentiment at those two times.
High and low are also important. The high is the highest price reached during the period. The low is the lowest price. Together they help to measure market volatility and range. Traders use this information to make decisions for future trades.
For example if the open is much lower than the close it means strong buying interest. If the open is higher than the close it means selling pressure.
Bullish vs Bearish Candles
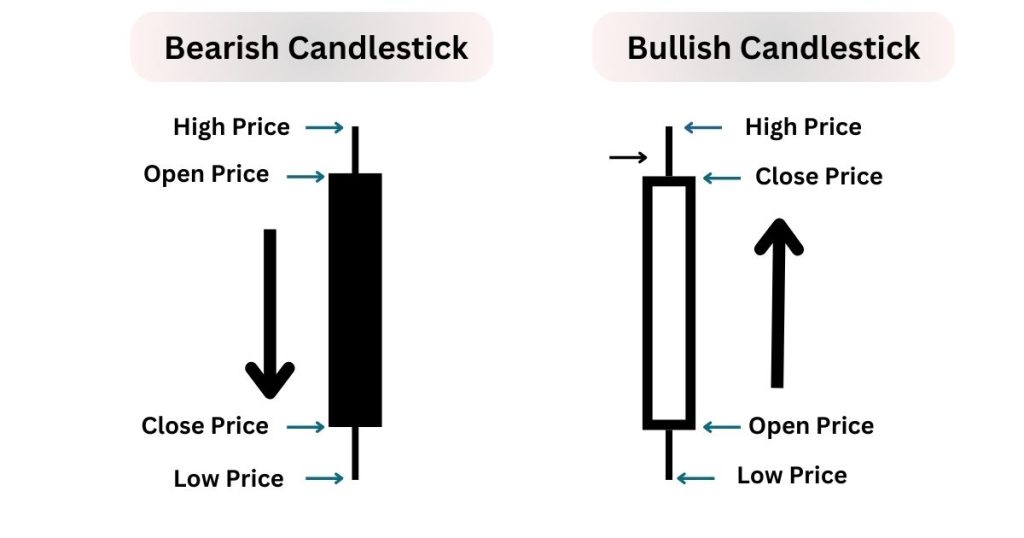
Bullish and bearish candlestick candles are based on the close price compared to the open price. A bullish candle is when the close is higher than the open. This means up price movement and means buyers are in control. One significant bullish formation is the bullish engulfing candlestick pattern, a two-candlestick reversal pattern that indicates a potential change in market trend from bearish to bullish, particularly when found at the bottom of a downtrend. The second candle’s body in this pattern is larger and engulfs the body of the first candle. Various bullish patterns, including the bullish engulfing candlestick pattern, signal potential price reversals and suggest favorable conditions for traders to consider initiating long positions.
A bearish candle is when the close is lower than the open. This means downtrend and means sellers are in control.
Color also determines market direction. Bullish candles are green or white, bearish candles are red or black. Traders use this to predict the market.
How to Read Candlestick Patterns
Step by Step
Reading candlestick patterns is key for traders. Start by identifying the candle type. Each red candle is either bullish or bearish. Bullish candles mean the price goes up, and bearish candles mean the price goes down.
Next look at the green candle in position. Is it at a support or resistance level? This gives you context to the market. Look at the surrounding candles too. A series of candles can tell you a story about market behavior.
Practice with live examples. Look at charts and identify different patterns. This will help you understand how candlesticks work together.
Trends
Candlestick patterns help you identify trends. Traders should look previous candle, for consecutive bullish or bearish candles. A series of bullish candles is an uptrend, and bearish candles are a downtrend.
Trend strength is key to trading decisions. Strong trends lead to big price movements. Recognizing these patterns early gives you an edge in the market.
Traders also need to consider the bigger picture. Look at other factors like volume and news events to get more insight into trends.
Reversal Signals
Some candlestick patterns are reversal signals. For example, a “hammer” is a bullish reversal after a downtrend. The ‘morning star candlestick pattern’ is an inverted hammer, another bullish reversal signal that traders look for after a downtrend. A “shooting star” is a bearish reversal after an uptrend. The ‘evening star pattern’ is a bearish reversal signal that indicates a shift from an uptrend to a downtrend. The ‘dark cloud cover’ is also a bearish reversal pattern that signals a potential decline in price.
Market sentiment is crucial when interpreting these signals. Traders should look for confirmation from other indicators before acting on reversal signals. This avoids false signals that can lead to losses.
Combining reversal signals with other analysis tools increases accuracy. Tools like moving averages or RSI (Relative Strength Index) can confirm trends and reversals.
Market Differences
FX Market Candles
Candlestick patterns in the FX market are different. Traders can see these patterns forming all the time. The FX market is open 24/5. This continuous trading means price movements are frequent. Traders get more opportunities to read the market.
Gaps in FX candles can occur over the weekend. Trading stops on Friday and resumes on Sunday. When the market opens on Sunday, prices can be higher or lower than before. This can impact your trading decisions. You need to consider these gaps when you decide.
Stock Market Candles
Stock market candlesticks are different from other markets mainly because of trading hours. The stock market has fixed hours. It opens at 9:30 AM and closes at 4:00 PM, Monday to Friday. This limited trading time affects how you read price direction.
Volume and liquidity are key in stock candlestick formation patterns. High trading volume means many buyers and sellers are in the market. This activity helps create clearer signals for you. Market news and events shape stock candlestick formations. For example, earnings reports can cause big price movements and how you interpret patterns.
Crypto Market Candles
The crypto market is known for its volatility. This volatility affects candlestick patterns. Prices can move big in a short time. Traders see big swings in price direction.
Crypto markets are open 24/7 which affects candle formation. Unlike stock or FX markets there are no breaks in trading. This continuous nature means more frequent updates of candlestick data. Market sentiment and news also matter in crypto analysis. Events like regulatory news can cause big price movements.
You need to consider these when analyzing crypto candles. You need to know how sentiment affects buyer and seller behavior.
Common Candlestick Charts Patterns
Doji and Spinning Top
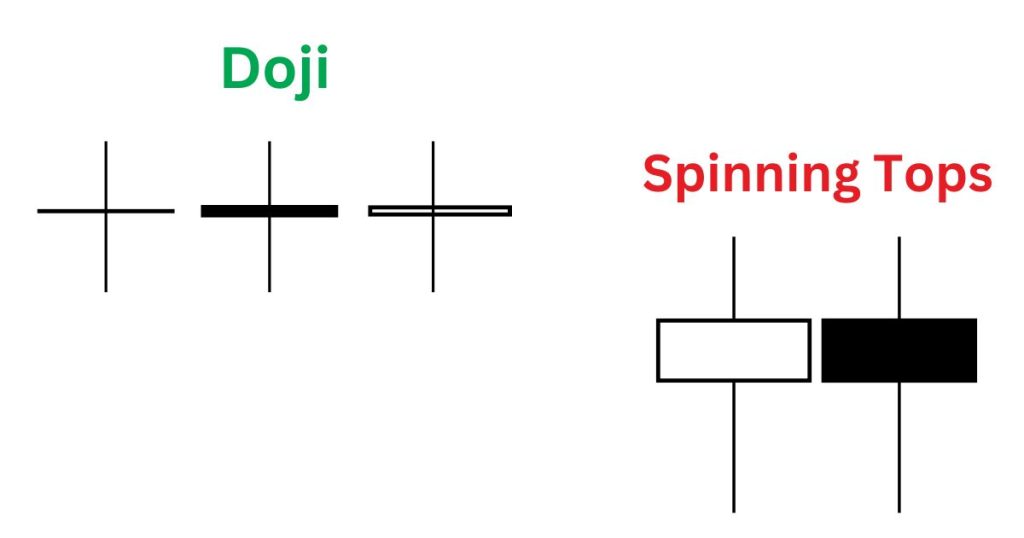
Doji and Spinning Top patterns show indecision in the market. A Doji is when the open and close are the same. A Spinning Top has a small body with long wicks on both sides. These patterns can be reversal or continuation signals.
These patterns mean buyers and sellers are in balance. You need to confirm these patterns with the next candle. If the next candle moves big, it may validate the pattern suggested by Doji or Spinning Top, reflecting the current market sentiment.
Bullish/Bearish Engulfing Pattern
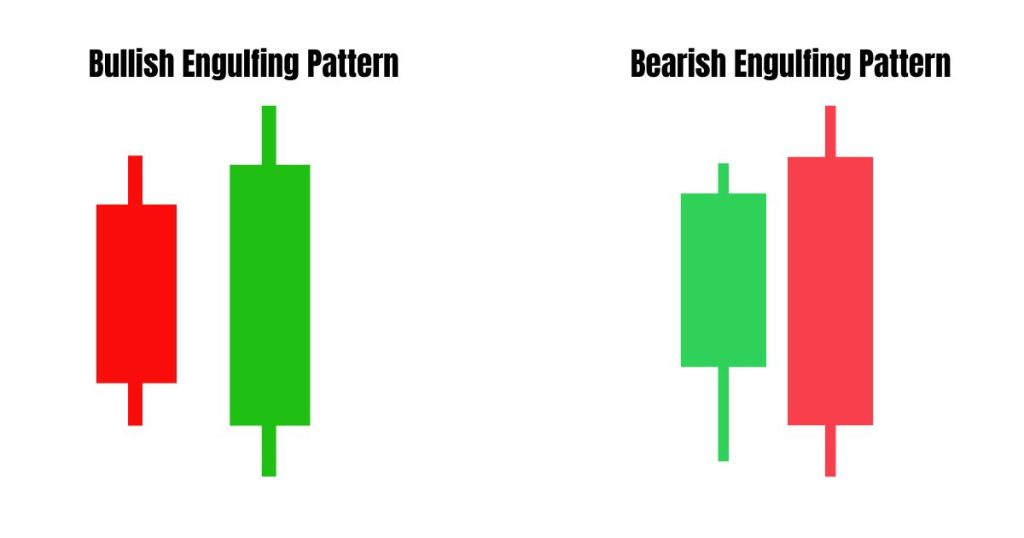
Bullish and Bearish Engulfing patterns are strong reversal signals. A Bullish Engulfing is when a smaller bearish candle is followed by a bigger bullish candle. A Bearish Engulfing is when a smaller bullish candle is engulfed by a bigger bearish one. The three black crows pattern is another bearish reversal signal.
Trading volume matters in these patterns. The high volume of the engulfing candle makes it more reliable. The black crows pattern, characterized by three consecutive bearish candlesticks and a long green candle, indicates strong selling pressure and suggests that the bears have taken control of the market. Look for this confirmation so you can make informed decisions based on these powerful candlestick patterns.
Hammer and Hanging Man
Hammer and Hanging Man patterns show market sentiment. Hammer appears after a downtrend and is a bullish reversal signal. It has a small body at the top with a long lower wick. Hanging Man appears after an uptrend and is a bearish reversal signal.
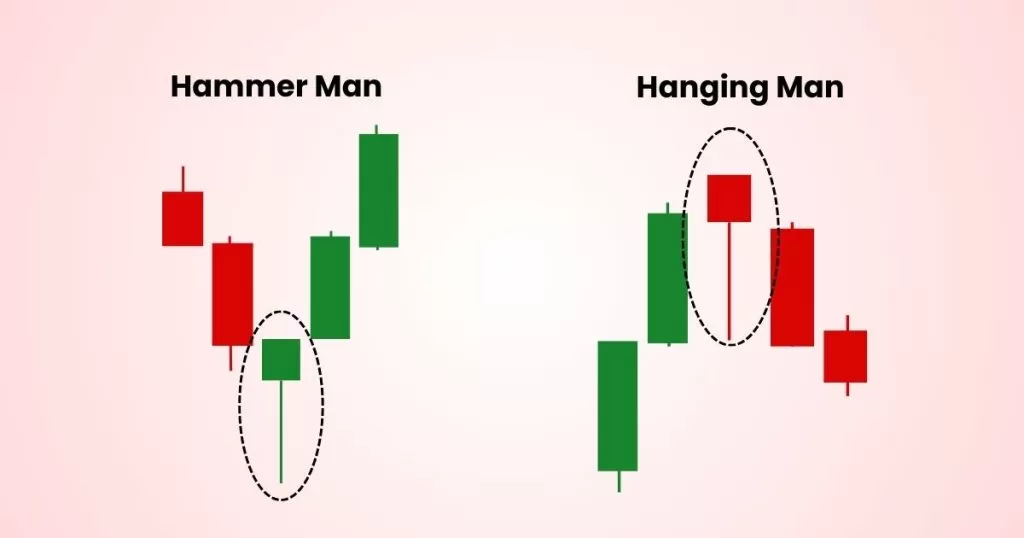
The position of these patterns in a trend is important. A Hammer at the bottom of the second candle in a downtrend means buyers are stepping in. You need confirmation from the next candles before acting on these patterns.
Abandoned Baby Top/Bottom
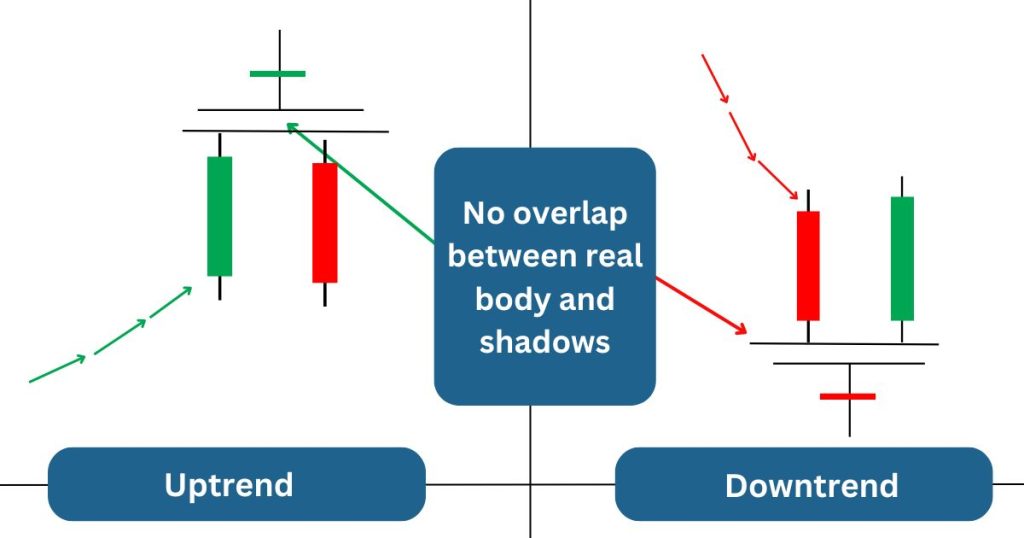
Abandoned Baby Top and Bottom are strong reversal signals. Abandoned Baby Top forms after an uptrend, Abandoned Baby Bottom after a downtrend. Both require specific conditions, gaps between candles, and positions.
These are rare but powerful when correctly identified. Gaps between the candles mean a big shift in market sentiment. Additional confirmation from the next price action is needed for trading decisions.
Long Tails
Why Long Tails Matter
Long tails in candlesticks are important as they indicate significant price movement. They show rejection and volatility. When a candle has a long tail it means the price moved a lot but closed near the open. This means buyers or sellers pushed the price in one direction but couldn’t hold that level.
The third candle in patterns like the Three Black Crows and Morning Star plays a crucial role by either confirming a bearish trend or signaling a reversal following an indecision phase.
Traders look at these tails. They help to gauge market sentiment and potential reversals. For example, a long tail at the top of an uptrend means buyers are losing strength. It means sellers are taking over. A long tail at the bottom of a downtrend means buyers are stepping in. This could be a reversal.
Using long tails helps traders to gauge buyer and seller strength. A long upper tail means sellers are strong enough to push price down after a rally. A long lower tail means buyers are ready to support the price after a decline. Understanding these signals will help you make better decisions.
Small Bodies
Small candle bodies have their own meaning and reflect market sentiment. They mean indecision among traders. A small body means open and close are close together. This means neither buyers nor sellers are in control.
In trending markets, small bodies can mean pause or reversal. For example, if there is a series of small bodies after an uptrend it means momentum is weakening. Be cautious as it could be a trend change.
In ranging markets small bodies confirm a lack of direction. Price will bounce between support and resistance levels without clear movement. Context is key when looking at these small-bodied candles. Look at surrounding candles and overall market conditions.
Understanding small bodies helps you to identify moments of uncertainty. Knowing when traders are hesitant can give you better entry or exit points.
Candlestick Pattern Reliability
Most Reliable Patterns
Experienced traders favor certain candlestick patterns for their reliability. Some of the most reliable patterns are the Doji, the Hammer, and the Engulfing Pattern. These patterns help you to predict price movement based on past behavior and are integral to various trading strategies.
Conditions play a big role in how these patterns work. For example, a Hammer pattern is more reliable when it appears at the bottom of a trend. An Engulfing Pattern means reversal when it appears after a clear downward trend. You must practice recognizing these patterns to improve your accuracy. Over time experience will help you to know which pattern works in which situation.
Pattern Reliability Factors
Several external factors can affect the reliability of candlestick patterns. Market conditions is one of them. In a volatile market, patterns won’t be as strong as they would be in a stable environment.
News events also affect pattern performance. For example, earnings reports or economic announcements can cause prices to move suddenly into bearish patterns. Trader sentiment plays a big role too. If traders are optimistic they will ignore bearish signals from candlestick patterns.
Looking at multiple factors is important when analyzing these patterns. Relying only on candlestick formations without context will lead to bad decisions. Look at the bigger picture, including market sentiment and the news, to improve your analysis.
Trading Application
Patterns in Strategy
Traders can incorporate candlestick patterns into their overall strategy. These patterns will help you to identify market movement and understand market behavior. Aligning these patterns with your risk tolerance is key. Every trader has different goals and risk comfort levels. Knowing this will help you make better decisions.
Ongoing education is important in trading. Markets change and so do trading conditions. Traders must adapt their strategy to stay relevant. Learning new candlestick patterns will give you an edge. This will allow you to react faster to market changes.
With Other Indicators
Using candlestick patterns with other technical indicators has many benefits. For example, combining these patterns with moving averages will improve your trading decisions. Moving averages will smooth out price data over time and will give you clearer trends. This combination will help you make better decisions.
A holistic approach to technical analysis will give you better results. Don’t rely on one method or indicator. Combine multiple tools for better accuracy. Using multiple indicators will reduce false signals and increase your confidence in your trades.
Backtesting and Analysis
Backtesting candlestick patterns is important to know their historical performance. This involves applying past patterns to see how they would have performed in real-time scenarios. This will help you to know which pattern works under which conditions and refine your trading strategies.
Methods to analyze past trades is to review entry and exit points. You can learn from winning trades and losing trades. This reflection will refine your future trading strategy and overall performance.
Ongoing learning is important in trading practices. Markets change and so should traders. Keep up with new strategies and tools to stay relevant.
Conclusion
Knowing candlestick patterns is key for traders. These patterns will give you insight to market behavior. By analyzing the components and learning to read them you can make better decisions. Recognizing common patterns will help you to predict price movement. The reliability of these patterns varies across different markets which is important for your trading strategy.
Apply this knowledge practically. Practice identifying patterns in real time. Ongoing learning and adaptation is important in this fast-changing world. Engage with more resources to deepen your understanding and improve your trading skills. This approach will give you better results in trading.
FAQs
What is a candlestick pattern?
A candlestick candle pattern is a visual representation of price movement in a financial market over a certain period of time. It has a body and wicks which represent open, close, high, and low prices.
How do you read candlestick patterns?
Reading candlestick patterns is to analyze the body and wicks. A long upper wick body means strong buying or selling pressure, short body means indecision. Patterns can mean market reversal or continuation.
What are common candlestick patterns?
Common candlestick patterns are Doji, Hammer, Shooting Star, and Engulfing patterns. The morning star pattern is a significant reversal pattern that consists of a bearish candle, an indecisive candle, and a bullish candle, indicating a potential bullish or trend reversal. Each has different market sentiment and price movement implications. The star pattern, including the Morning Star and Evening Star, plays a crucial role in indicating potential trend reversals, with the Morning Star suggesting a shift from a downtrend to an uptrend and the Evening Star indicating the opposite.
How reliable are candlestick patterns?
Candlestick patterns are not 100% reliable. They will give you market trends but use with other technical analysis tools to improve accuracy.
Do candlestick patterns work across markets?
Yes, candlestick patterns work across markets like stocks, forex, and commodities. Market volatility and trading volume will affect the effectiveness of these patterns.
Can I use candlestick patterns as a beginner?
Yes, you can use candlestick patterns as a beginner. However, you must understand the meaning and practice risk management before making decisions based on these patterns.
How to apply candlestick patterns?
Apply candlestick patterns with other technical indicators and market analysis. This will make your decision better and more winning trades.


