Statistical charts and graphs are used over time to characterize market price and volatility of securities. Bollinger bands are a popular methodical tool supports trading decisions. The article discusses more Bollinger band definition, history, and working.
What is Bollinger Band?

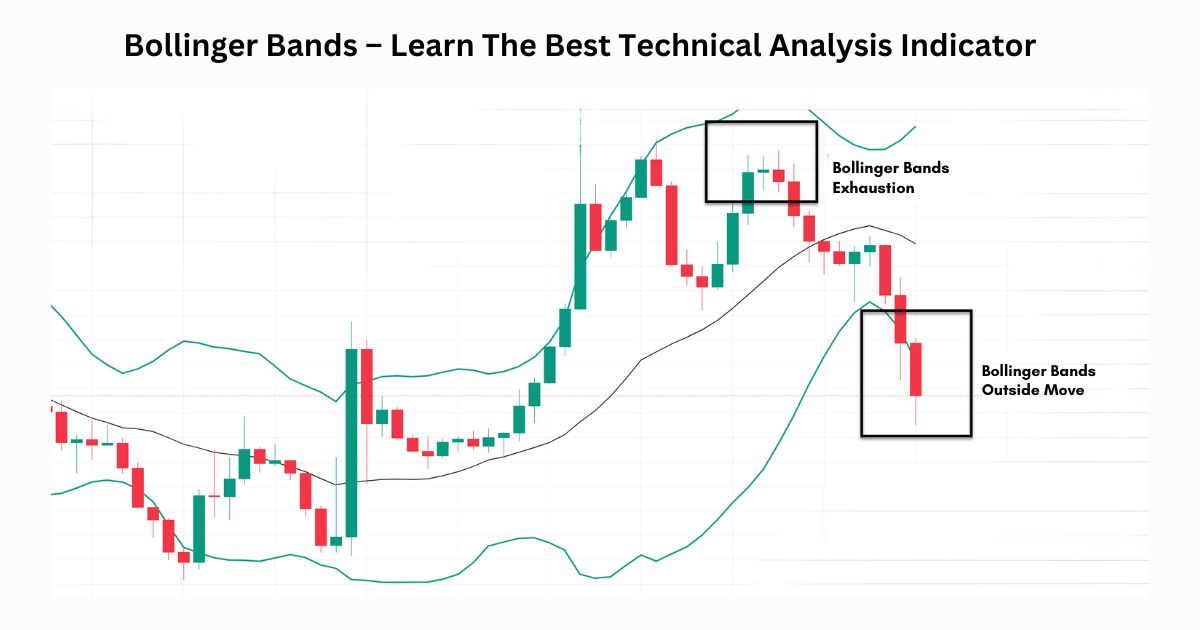
Developed by John Bollinger, Bollinger bands are one of the popular technical tools for technical analysis where three lines are drawn, the middle line is a simple moving average that is generally set at 20 periods. The upper and lower lines are typically 2 standard deviations +/- from a simple moving average. These are calculated on the basis of past volatility of the stock.
How Bollinger Bands was invented?
The history of using trading bands and envelop is very old and interesting. Envelopes are made above and below the moving average in the price chart. Many techniques have been used in the past such as moving the average envelope, KELTNER BAND Formula, etc. But the problem with most of these techniques is that they have placed bands in a symmetrical distance from the moving average and due to this symmetrical structure, most of the price data isn’t covered. In early 1980, Bomar bands were introduced. Bomar bands cover 85 % of the price data. Bollinger bands resolve this problem by covering 95% of price data inside the bands.
How Bollinger Bands Works?
In Bollinger band price moves between upper and lower bands. If the price reaches near the upper band stock becomes overbought and if the price reaches near the lower band it becomes oversold. The width of Bollinger bands changes based on volatility. If volatility increases the distance between both bands increases and if the volatility decreases, then the distance between band both bands decreases.
Unlike Oscillators such as RSI (Relative strength index), stochastics, etc. which only tell when a stock becomes overbought or oversold, Bollinger bands not only indicate whether the stock is overbought or oversold but also predict price targets of stocks.
If the price rises from the lower band and crosses the 20-period moving average then we can buy stock with the upper band as a target and if prices fall from the upper band and cross the 20-period moving average then we can short stock with the lower band as a target. In a strong uptrend, the price travels between the upper band and the moving average and an indication of trend reversal comes when the price crosses the moving average towards the south.


