What is alpha in stock market?
Alpha tells you how much a stock or portfolio beat or lagged its expected


Alpha tells you how much a stock or portfolio beat or lagged its expected

Beta shows how sensitive a stock is to market moves. A beta of 1

Trading volume is the total number of shares or contracts traded during a period.

Everything you need to know about stock market education and Indian stock market from basics to analysis to strategies to risk management. Economic indicators, regulatory framework, sustainable investing in India, tax, technology in trading and continuous learning resources. Investor protection and practical advice for both new and experienced investors.

Technical analysis is a method used to predict future price movements in financial markets.

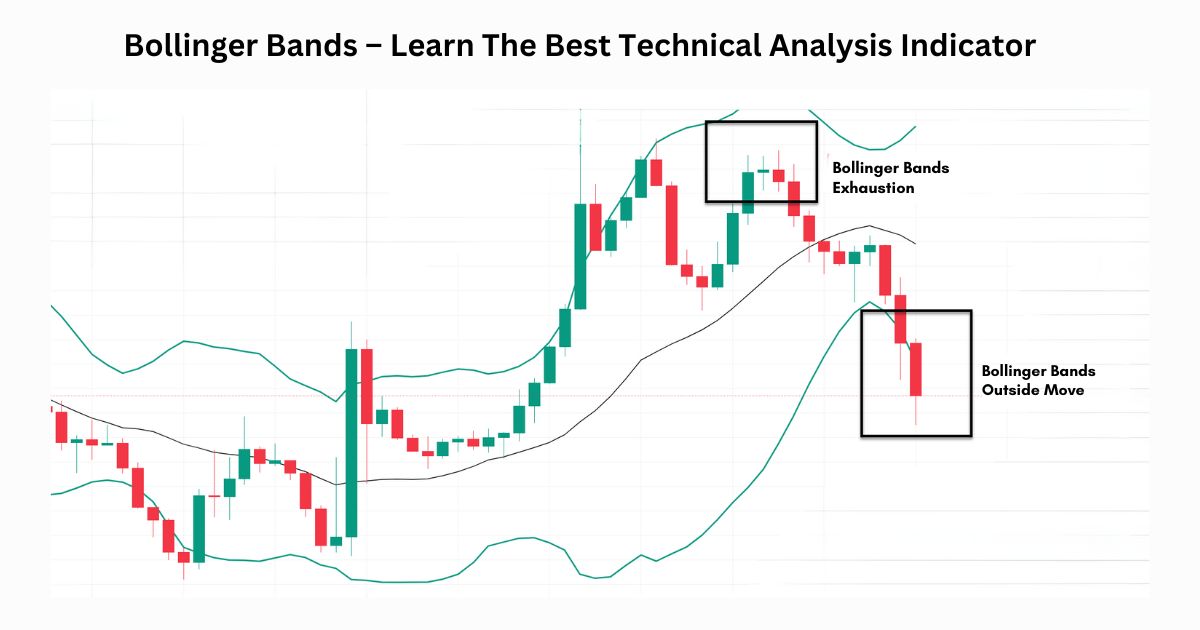
Bollinger bands are one of the popular technical tools for technical analysis where three lines are drawn, the middle line is a simple moving average that is generally set at 20 periods. The upper and lower lines are typically 2 standard deviations +/- from a simple moving average. These are calculated on the basis of past volatility of the stock.

Best stock trading strategy step-by-step guide will help investors to uncover opportunities in the markets. By applying professional stock market strategies, an average investor can benefit to profitable trades.

Technical analysis forms the backbone of successful stock trading strategies. At IFMC Institute, we

IFMC Institute offers Fundamental and Technical Analysis Course in India where both fundamental and technical analysis is covered for a complete understanding of the stock market. The course covers economic, industry and company analysis, chart patterns and technical indicators. With both classroom and online options it is suitable for beginners and professionals both and provides practical skills for various financial market roles.

Technical analysis course for beginners offers students to learn the tools required for successfully traverse the gap between intrinsic value and market price. Technical analysis involves the study of chart pattern and indicators Technical analysis course for beginners offers students to learn the tools required for successfully traverse the gap between intrinsic value and market price.