What is Technical Analysis? A Comprehensive Guide
Technical analysis is a method used to predict future price movements in financial markets.


Technical analysis is a method used to predict future price movements in financial markets.

In this article, explore the best intraday trading strategies for beginners. These strategies are powerful and proven to help you gain profitable trades. Our guide to 15 powerful strategies on intraday trading aims to help novice traders to adroit the skills to earn profits.

Let’s learn how stock market data and event from last week can help intraday traders prepare for the upcoming week. Prepare for upcoming stock market challenges using economic data analysis.

Undoubtedly stock markets are most affected by economic weather of a country. There are different economic Events and data to understand that affect the economy. Let’s understand the economic slowdown and its effects.

Maiden budget speech read by the Madam Finance Minister was innovative on many counts. Like she did not, even once, sipped the water during her 2 hours 10 minutes speech. It brought financial documents to the house in a red cloth cover like a conventional bahi khata instead of an executive briefcase.

Readers, please do a favor for yourself, rewind your memories to recall the Maggi noodles controversy. The case was, the lead was found excessive of the permissible limits set by the FSSAI. Although no hazardous effects were observed to the consumer of the product, obviously it was a contravention of the food safety standards in India.

The union budget 2019 is around the corner, the ruling party is the same, the prime minister is the same but the finance minister is different. In the previous tenure of the Government, the helm of the finance ministry was with the person who was more politician and lawyer than an economist.

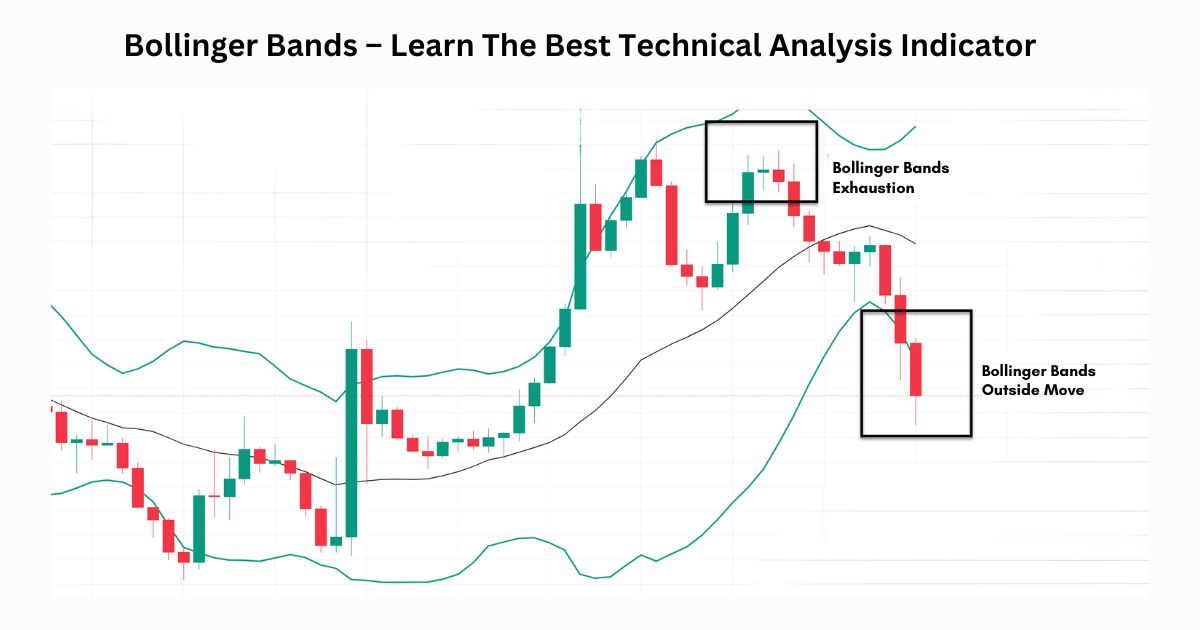
Bollinger bands are one of the popular technical tools for technical analysis where three lines are drawn, the middle line is a simple moving average that is generally set at 20 periods. The upper and lower lines are typically 2 standard deviations +/- from a simple moving average. These are calculated on the basis of past volatility of the stock.

The previous government of the political party which led the previous Government is back again with the thumping majority; congratulations. It is very clear that Mr. Modi will hold the reins of country affairs with a firm grip for the next five years. The Indian stock market salutes the electoral verdict as Nifty and Sensex kissing new highs.

Different factors affect the performance of the stock markets. The factors can be broadly classified as may be political, economic, financial or even weather that can affect the stock market performance. The article discusses the effect of monsoon on stock market performance.