Trading volume is the total number of shares or contracts traded during a period. Volume shows participation and interest in a stock or index. You use it to confirm price moves, spot breakouts, and judge liquidity. Learn the meaning, how to read volume with price, and simple ways to use it in trades.
Volume Meaning, in One Minute

- Volume counts how many units changed hands in that session, for example one day or one 5-minute bar.
- Higher volume signals stronger conviction. Lower volume signals weak interest.
- Exchanges publish volume for each security and index. You can also view historical “price–volume” archives on NSE.
Why Volume Matters
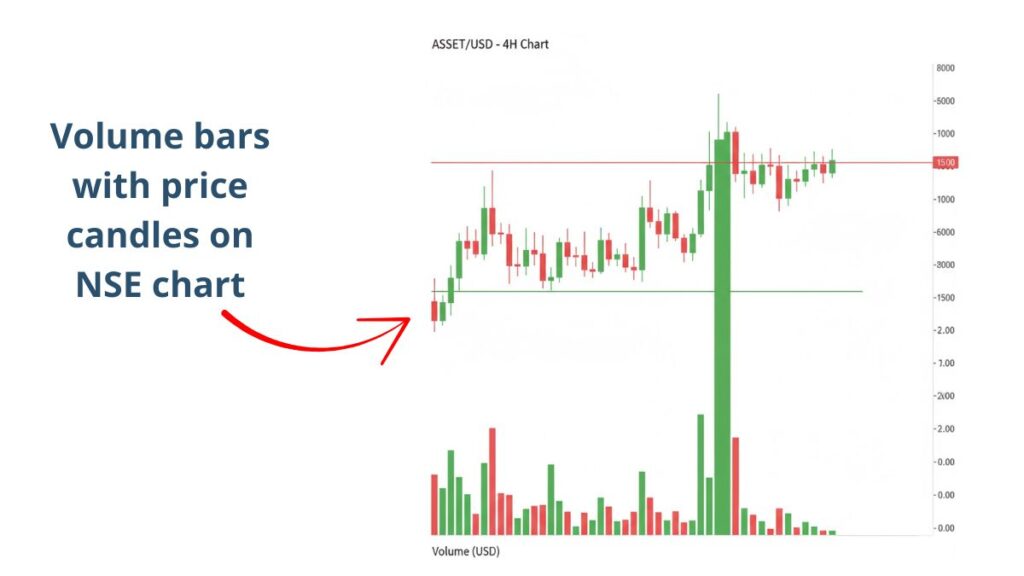
- Confirms trend strength, for example rising prices with rising volume show demand.
- Helps validate breakouts from support or resistance.
- Improves order fills and reduces slippage due to better liquidity.
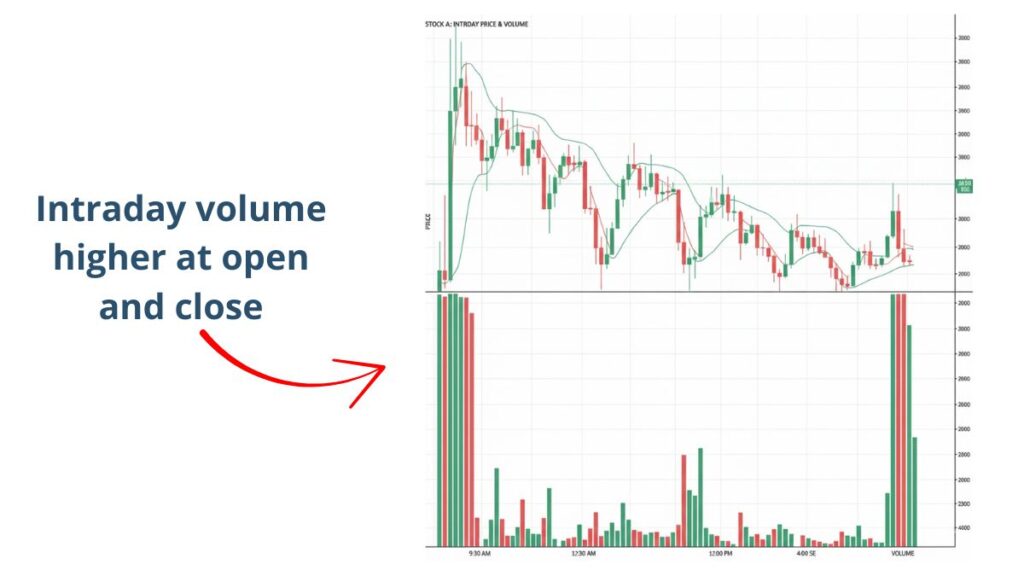
- Typical intraday pattern, busy at open and close, quieter mid-session.

How to Learn More About Volume
- Stock market course for beginners
- Free stock market course
- Technical analysis course online
- UDTS intraday trading course
- Introduction to stock market
How to Read Volume with Price
Price Up + High Volume
- Bullish confirmation, buyers in control.
Price Up + Low Volume
- Caution, move may fade.
Price Down + High Volume
- Bearish confirmation, strong selling pressure.
Price Down + Low Volume
- Weak downside momentum, possible pause.
Simple Numbers You Should Track
- Average Daily Volume, ADV, 20-day or 50-day average.
- Volume Run Rate, compare today’s intraday volume with ADV to gauge likely close.
- Relative Volume, RVOL = Today’s volume ÷ ADV
Example: ADV = 2,000,000 shares. By 12:30 pm, traded 1,400,000 shares. RVOL midday ≈ 0.7. If run rate holds, day may finish above ADV.
Popular Volume Indicators, Plain English
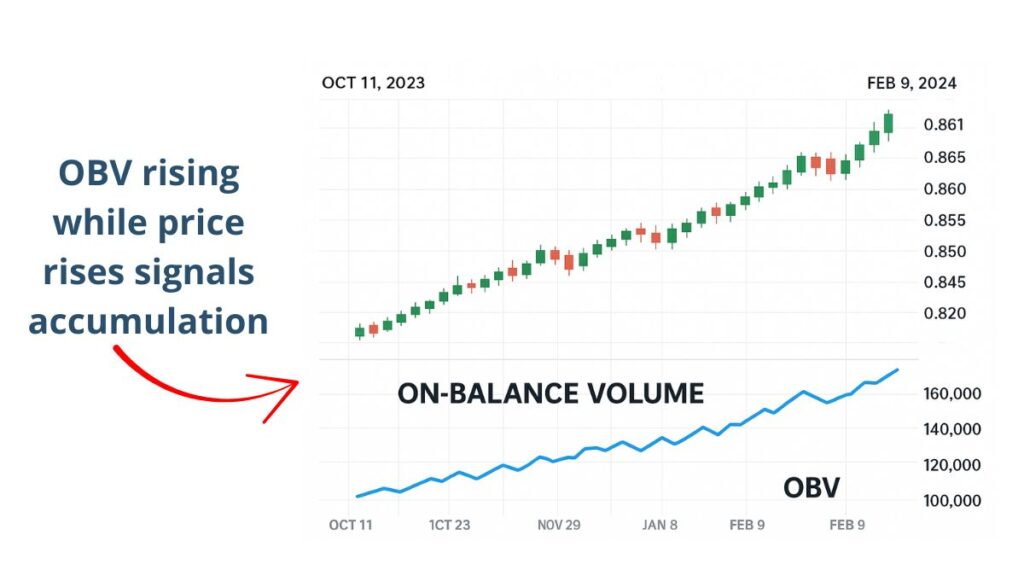
- OBV, On-Balance Volume. Adds volume on up days and subtracts on down days to show whether volume supports the price trend.
- VWAP, Volume-Weighted Average Price. Shows the average price paid today, weighted by volume. Useful for entries and exits.
- Accumulation/Distribution. Blends price close location with volume to spot buying or selling pressure.

Volume vs Open Interest, Quick Check
• Volume = turnover today.
• Open Interest, OI = open contracts still outstanding in derivatives. Use both to confirm trends in futures and options.
Practical Examples
- Breakout example, stock crosses 200-day moving average with 2.5× RVOL. Probability of follow-through is higher than a low-volume cross.
- Pullback example, price dips 1 percent on half the ADV. Selling pressure looks weak.
Common Mistakes
- Treating every spike as news, check if it is opening auction or block trade.
- Using one indicator alone, confirm with price structure and risk rules.
- Ignoring liquidity, avoid thin stocks with wide spreads.
Tools to Track Volume
- Broker charting, mobile apps, and free screeners show volume by bar.
- NSE “Security-wise Price Volume Archives” provide official history for research.
Next Steps
- Learn basic charts and support-resistance.
- Practice reading volume with price on a few liquid NIFTY 50 stocks.
- Keep a log. Note the RVOL, context, and your trade outcome.
FAQs
What is trading volume
The total number of shares or contracts traded in a period such as a day.
Is high volume always good
No. High volume with falling price confirms selling. High volume on news can be one-off.
How do I find a stock’s average volume
Use a 20-day or 50-day average shown on most charting tools, or calculate from historical data.
Does volume work on intraday charts
Yes. Compare current bar volume to recent bars or to ADV. Volume is usually highest near the open and close.
What is a healthy RVOL for breakouts
Many traders look for 2× or higher. Use it with price structure and risk rules.
Disclaimer: Education only. This is not investment advice.


