Stock trading is about timing and precision. Every successful trader looks for methods to predict future market movements. One such powerful approach is the Gann Theory, developed by W.D. Gann, one of the most respected traders in history.
If you’re a beginner trader trying to understand how professionals identify key price and time levels in the market, this guide explains what Gann Theory is, how it works, and how you can learn it through IFMC Institute’s Gann Theory Course.
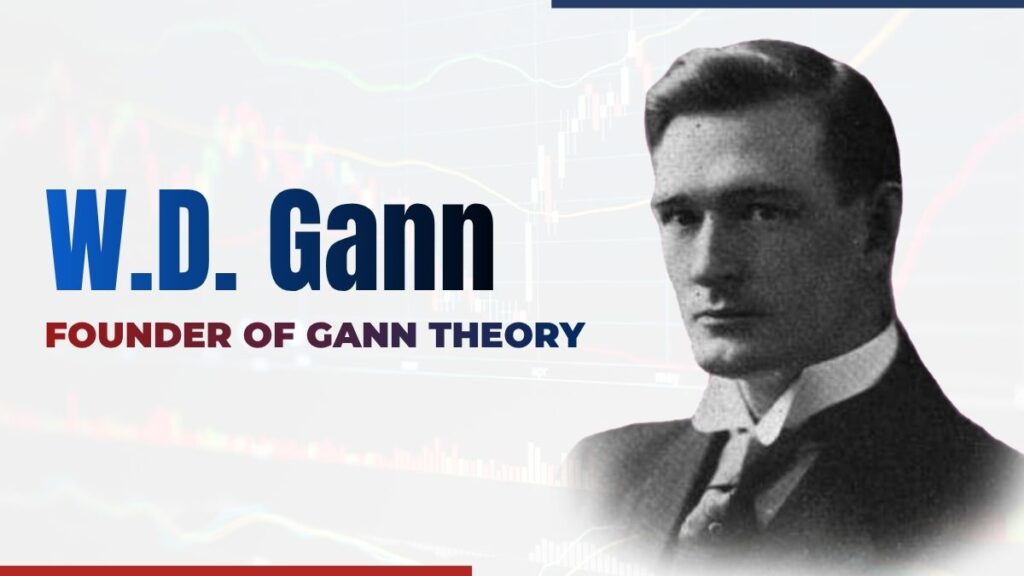
Who Was W.D. Gann?

William Delbert Gann (1878–1955) was an American trader and market analyst known for developing forecasting tools based on geometry, astrology, and ancient mathematics.
He believed that price movements in financial markets are not random. Instead, they follow natural laws that repeat over time. His tools like Gann Angles, Square of Nine, and Time Cycles help traders forecast potential turning points in the market.
Even today, his theories are widely used by technical analysts and professional traders around the world.
What is Gann Theory in the Stock Market?
Gann Theory is a method of technical analysis that studies the relationship between price, time, and pattern to predict future market movements.
It is based on the idea that the market moves in geometric angles. When these angles align with time cycles, significant reversals or breakouts often occur.
For example, if a stock’s price moves up at a 45-degree angle, it represents a perfect balance between price and time. When this balance breaks, traders can anticipate a trend change.
Core Principles of Gann Theory
Gann Theory combines mathematical precision with price-time relationships. Here are the main principles every trader should know:
1. Gann Angles
Gann used angles to measure market trends. The most important is the 1×1 angle (45°), which means one unit of price moves in one unit of time.
When the market trades above the 1×1 angle, it indicates strength. When it trades below, it signals weakness.
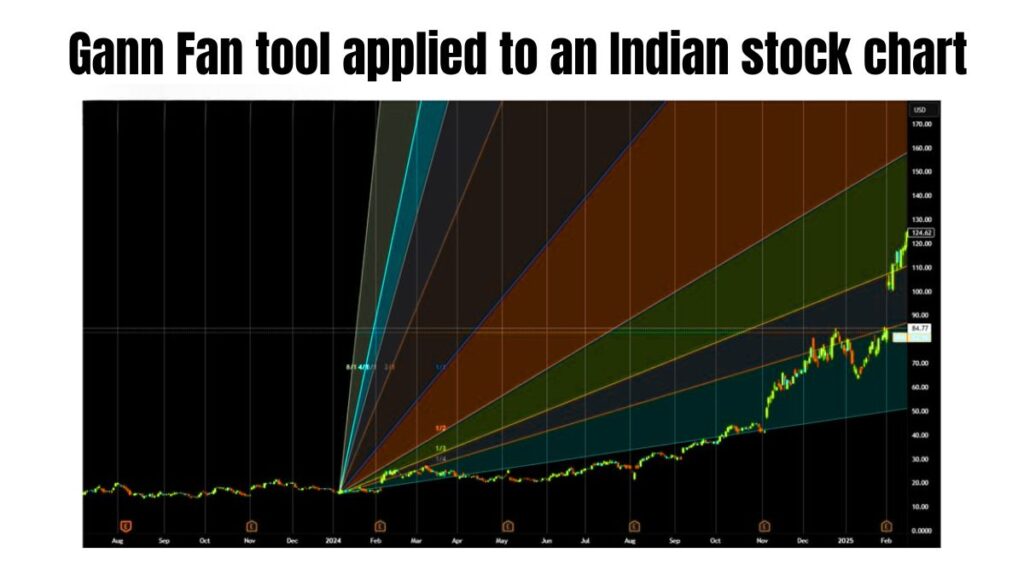
Traders use tools like Gann Fan to draw multiple angles (1×2, 2×1, 1×8, etc.) to visualize potential support and resistance zones.
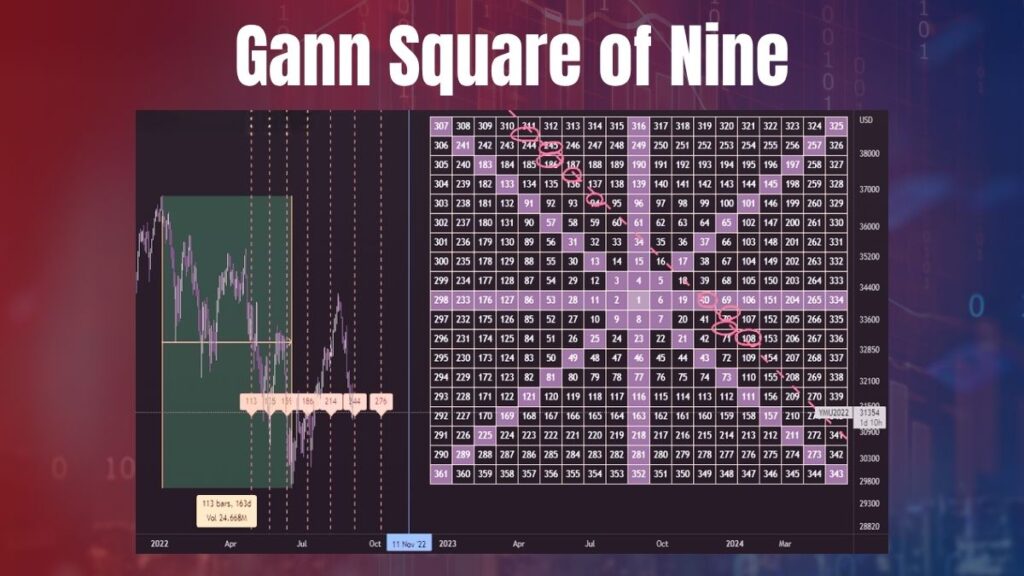
2. Gann Square of Nine

The Square of Nine is a spiral of numbers arranged in a grid. It helps identify price levels that are geometrically significant.
Traders use this tool to find key resistance or support levels based on angular relationships between numbers.
Example: If Nifty trades near 22,500, the Square of Nine helps project possible reversal points such as 22,830 or 22,170.
3. Gann Fan

The Gann Fan is a charting tool available on most trading platforms. It consists of multiple diagonal lines drawn from a central price point.
Each line represents a unique relationship between time and price. These lines help traders identify trend continuation zones or trend reversals.
4. Gann Time Cycles
Gann believed that markets repeat patterns over fixed time intervals.
For example, if a major rally lasts 90 days, you may observe another major move after 90 or 180 days.
Understanding these time cycles allows traders to anticipate when trends might change.
How Gann Theory Helps in Trading
Gann Theory helps traders with:
- Entry and Exit Points: Identifying the exact time when the market might reverse.
- Trend Identification: Understanding whether the market is trending up, down, or sideways.
- Price Targets: Calculating future price levels using geometric projections.
- Risk Management: Using angles and time relationships to set stop-loss and take-profit zones.
Example:
Suppose Reliance Industries trades at ₹3,000. Using Gann angles, if the 1×1 line projects ₹3,150 after 15 trading sessions, a break below this line could signal trend reversal.
Such methods help traders plan trades with better precision.
Difference Between Gann Theory and Technical Analysis
| Basis | Gann Theory | Traditional Technical Analysis |
|---|---|---|
| Approach | Based on geometry and time cycles | Based on indicators and chart patterns |
| Core Tools | Angles, Square of Nine, Time Cycles | RSI, Moving Averages, MACD |
| Focus | Predictive forecasting | Reactive trend confirmation |
| Suitable For | Price-time analysis | General market analysis |
Traditional analysis tells you what is happening in the market.
Gann Theory helps you forecast what will happen next.
Learn Gann Theory with IFMC Institute

If you want to master this unique forecasting method, join the Gann Theory Course by IFMC Institute.
Course Highlights:
- Understand Gann Angles, Square of Nine, and Time Cycles step-by-step.
- Learn how to apply Gann tools to Indian stock charts.
- Suitable for beginners and intermediate traders.
- Online, self-paced learning with lifetime access.
- Certificate of completion provided digitally.
Course Fee: ₹2,200
Duration: Approx. 15 hours
Certificate: Digital
Enroll today and start learning how professional traders predict market turns using Gann principles.
Related IFMC Courses
Explore more IFMC courses to build a strong foundation in trading:
These courses complement Gann Theory and help you learn market structure, chart reading, and strategy design.
FAQs About Gann Theory
What is the formula of Gann Theory?
There is no fixed formula. Gann Theory uses geometry and time to study market cycles through ratios and angles.
Can beginners learn Gann Theory easily?
Yes. With structured guidance, beginners can understand Gann’s tools and use them in real trading scenarios.
Is Gann Theory suitable for intraday trading?
Yes. Many traders use Gann angles and Square of Nine levels to predict intraday price targets.
Is Gann Theory still relevant in modern markets?
Yes. Although developed a century ago, Gann methods still apply because human psychology and price behavior remain consistent.
Ready to decode the markets using mathematical precision?
Join IFMC Institute’s Gann Theory Course and learn how professional traders predict future price movements with accuracy.


