Beta shows how sensitive a stock is to market moves. A beta of 1 means the stock tends to move with the market. Above 1 means bigger swings. Below 1 means smaller swings. You can use beta to judge risk, size positions, and estimate expected return with CAPM. In this guide, you will learn the meaning, the formula, a quick example, where to find beta for Indian stocks, and the limits you must respect.
- Beta Meaning, Simple Definition
- How Beta Works, One-Minute Example
- Understanding the Use of Beta in Intraday Trading
- UDTS ROBO TRADE and Beta Customization
- Why This Matters
- Beta Formula and Calculation Steps
- Interpreting Beta Values
- Where to Find Beta for Indian Stocks
- When to Use Beta, When to Ignore It
- Beta vs Volatility vs Correlation
- CAPM, Expected Return with Beta
- High Beta vs Low Beta Sectors, India Context
- Common Myths and Limits of Beta
- Practical Use Cases
- FAQs
- Next Steps and Learning
- Closing
Beta Meaning, Simple Definition

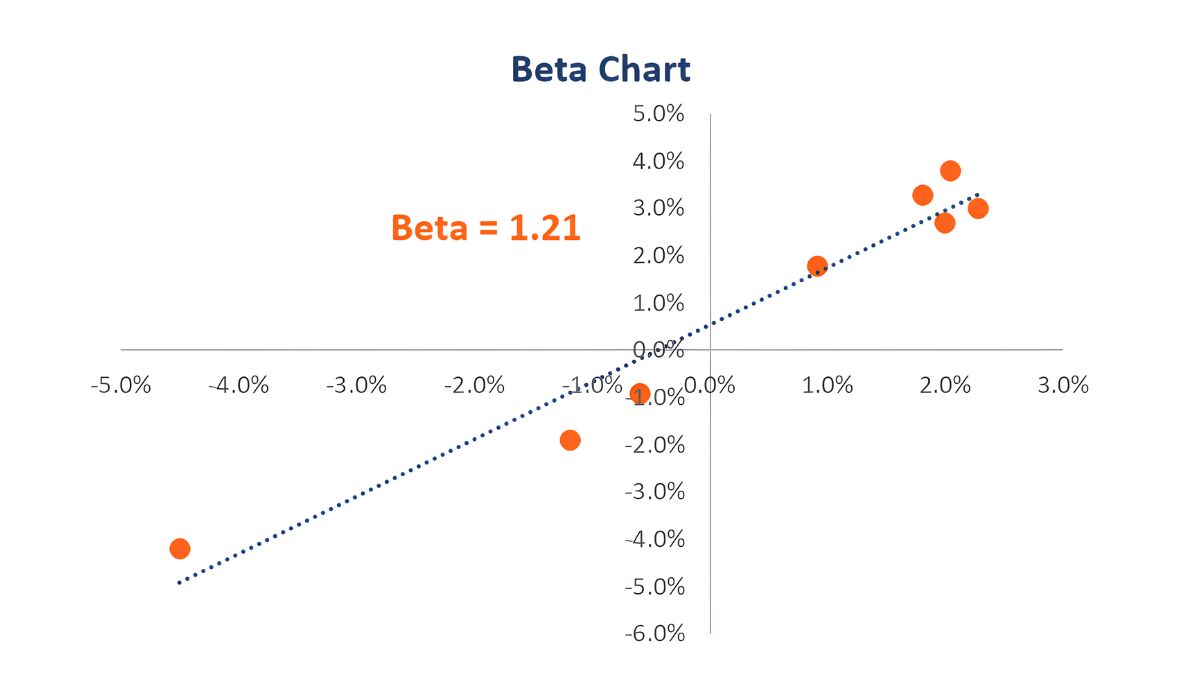
- Beta measures the relationship between a stock’s returns and the market’s returns.
- It is a single number. It shows direction and magnitude.
- Use it for risk awareness and portfolio construction, not as a signal by itself.
How Beta Works, One-Minute Example
• If Nifty 50 moves 1 percent and your stock has beta 1.5, it tends to move 1.5 percent in the same direction.
• If beta is 0.7, it tends to move 0.7 percent.
• If beta is negative, it often moves opposite to the market.
Key takeaway: Beta is a tendency, not a promise.
Understanding the Use of Beta in Intraday Trading
Beta is a measure of a stock’s volatility relative to the broader market (typically the Nifty 50 index in India). In intraday trading, beta plays a crucial role in setting stop-losses (SL) and targets (TGT).
Key Uses of Beta in Intraday Trading
- Volatility Indicator:
- A high beta stock moves more than the index – it’s more volatile.
- A low beta stock moves less than the index – it’s more stable.
- Setting SL and Targets:
- High Beta: Bigger Stop Loss (SL) and Target (TGT) levels.
- Because these stocks move sharply, giving more room avoids getting stopped out early.
- Low Beta: Smaller SL and TGT.
Because of limited movement, tighter SL/TGT makes more sense.
UDTS ROBO TRADE and Beta Customization
The UDTS ROBO TRADE (algorithmic version of the UDTS intraday strategy) enhances trade accuracy by using separate average beta values for:
- Nifty stocks
- Non-Nifty stocks
This differentiation helps in:
- Better risk management (right-sized stop-losses),
- More realistic target setting based on expected price movement,
- Improved win rates over generic intraday software that uses fixed parameters.
Why This Matters
Most intraday traders fail because they use a one-size-fits-all model for SL/TGT, ignoring the volatility profile of the stock. By adapting SL/TGT using beta, UDTS ROBO TRADE ensures:
- Trades breathe with the stock’s natural movement.
- Better risk-reward alignment.
- Fewer premature exits on volatility spikes.
Summary
| High Beta | Large | High | Momentum stocks, news-driven trades |
| Low Beta | Small | Low | Defensive or range-bound stocks |
UDTS ROBO TRADE’s separate beta tracking for Nifty and non-Nifty stocks is a key reason for its superior performance over other intraday systems.
Beta Formula and Calculation Steps

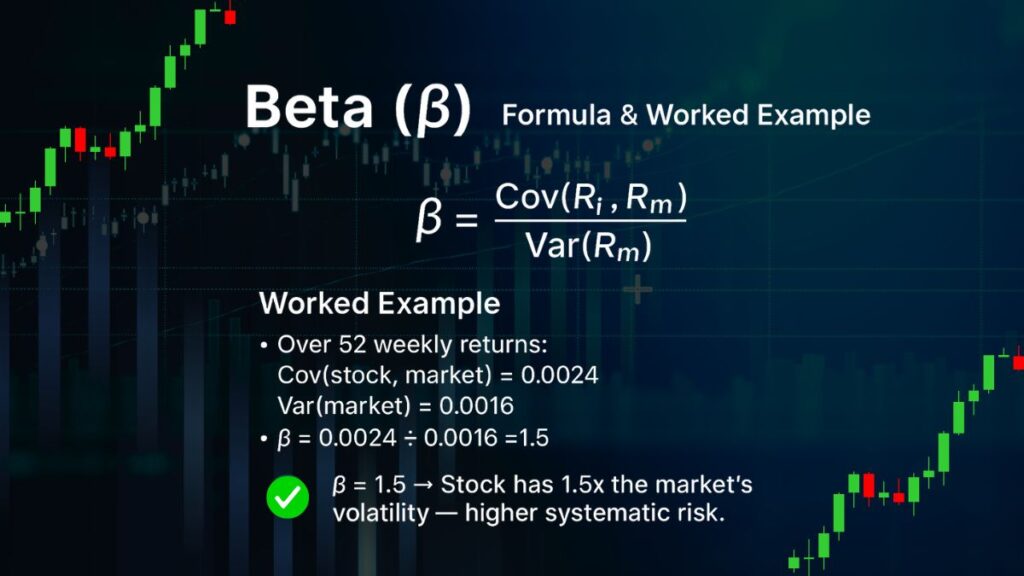
• Core formula, β = Covariance(stock, market) ÷ Variance(market)
• Regression view, slope of stock returns regressed on market returns
Worked example
• Over 52 weekly returns, Cov(stock, market) = 0.0024, Var(market) = 0.0016
• β = 0.0024 ÷ 0.0016 = 1.5
Compute Beta in Excel or Google Sheets
- Pull weekly close prices for the stock and Nifty 50.
- Convert to weekly log returns.
- Use COVARIANCE.P for covariance and VAR.P for market variance.
- Beta = Cov ÷ Var.
- Or run LINEST with market returns as X and stock returns as Y. The slope is beta.
Tip, Keep the same frequency for both series.
Interpreting Beta Values
| Beta value | What it suggests | Typical use |
| ≈ 0 | No relation to market | Treat as idiosyncratic |
| 1 | Moves with market | Benchmark-like risk |
| 0 to 1 | Lower swings than market | Defensive tilt |
| > 1 | Higher swings than market | Aggressive tilt |
| < 0 | Often opposite direction | Rare in equities |
Key takeaway: Higher beta often means larger drawdowns in sell-offs.
Where to Find Beta for Indian Stocks

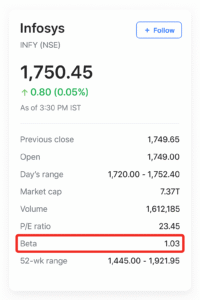
- Exchange and broker portals often show beta on stock summary pages. Check the lookback window.
- Many screeners show 1-year, 2-year, or 5-year beta. Confirm the index used, Nifty 50 or sector index.
- If values differ across sites, calculate your own with the steps above.
When to Use Beta, When to Ignore It
Use beta when
• Sizing positions by risk. Cut size on high-beta names.
• Balancing a portfolio to a target beta.
• Estimating expected return in CAPM.
Be careful or ignore beta when
• The company is in an event window, results, merger, pledge issues.
• Regime shifts change correlations.
• Liquidity is thin or the price series is noisy.
• You trade intraday. Daily or weekly beta may not help.
Beta vs Volatility vs Correlation

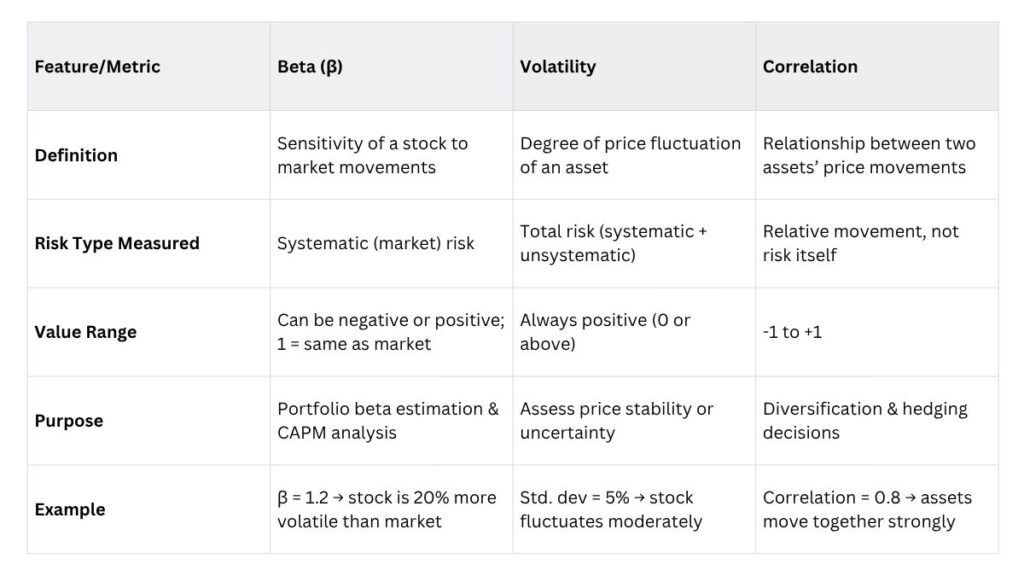
- Beta measures market-linked sensitivity. Unit, none.
- Volatility measures total variability. Unit, percent.
- Correlation measures direction strength from −1 to +1.
You can have low volatility and high beta if the market variance is small. Always check all three.
CAPM, Expected Return with Beta
Formula
Expected Return = Risk-free Rate + β × (Market Return − Risk-free Rate)
Example
• Risk-free = 7 percent
• Market return = 12 percent
• Beta = 1.2
• Expected Return = 7% + 1.2 × 5% = 13%
Note, This is a model estimate, not a guarantee.
High Beta vs Low Beta Sectors, India Context
- Often higher beta, smallcaps, capital goods, metals, realty.
- Often lower beta, FMCG, utilities, large diversified IT.
Treat these as tendencies. Check current data before acting.
Common Myths and Limits of Beta
- Myth, Beta predicts future returns. Reality, it explains co-movement, not alpha.
- Myth, Beta is stable. Reality, it shifts with timeframes and market regimes.
- Limit, Beta ignores company fundamentals and liquidity.
- Limit, Beta depends on the chosen index and frequency.
Practical Use Cases
- Position sizing, Use smaller sizes for β > 1. Use larger sizes for β < 1 if your rules allow.
- Stop-loss planning, Expect wider swings on high-beta stocks.
- Portfolio control, Target a portfolio beta near 1 if you track the market.
- Education next step, Learn entries, exits, and risk rules in our Technical Analysis Course.
FAQs
What is beta in stocks?
Beta measures how sensitive a stock’s returns are to market returns. A beta of 1 moves with the market. Above 1 moves more. Below 1 moves less. Negative moves opposite.
How do I calculate beta?
Use covariance of stock and market returns divided by market variance, or take the regression slope of stock returns on market returns over the same period.
What is a good beta for beginners?
If you want calmer moves, prefer beta between 0.5 and 1. If you want bigger swings and can handle drawdowns, you may consider beta above 1.
Does beta predict future returns?
No. Beta helps with risk awareness and sizing. Use it with fundamentals and technical analysis.
What is negative beta?
It often means the stock tends to move opposite to the market. It is rare and can be unstable.
Where can I find beta for Indian stocks?
Check exchange or broker research pages. Confirm the lookback window, index, and method.
Next Steps and Learning
• Learn risk rules, entries, and exits in our Technical Analysis Course.
• Apply systematic rules with our UDTS Course.
• Join our Investo Trade Mantra course.
• Explore advanced patterns in Elliott Wave Theory.
• Browse more guides on the Stock Market Blogs.
• Prefer personal help, message us on WhatsApp.
Want a mentor to review your plan? Chat now on WhatsApp.
Closing
Beta helps you judge how a stock may move against the market. Use it to size positions and plan risk. Pair it with fundamentals and technicals for better decisions. Learn the rules in our Technical Analysis Course, then apply them with UDTS. Prefer help, message us on WhatsApp.


